Taylor Series
Note: This file was originally a Maple file, but it was converted to Word format for easier display on the web. It is not a live Maple file, and calculations can not be made in this file.
We will use Maple to calculate partial sums (Taylor polynomials) of a Taylor series, and then we will plot graphs of the partial sums and the function being approximated.
Let ![]() . We will look at Taylor polynomials expanded
about
. We will look at Taylor polynomials expanded
about ![]() ,
that is, we will look at Maclaurin polynomials for this function.
,
that is, we will look at Maclaurin polynomials for this function.
> restart;
> f:=x->sin(x);c:=0;
![]()
![]()
Calculate the derivatives needed for the first nine Maclaurin polynomials and evaluate these polynomials at c.
> n:=9;a[0]:=f(c);
![]()
![]()
> for k from 1 to n do a[k]:=evalf(subs(x=c,diff(f(x),x$k)));od;
![]()
![]()
![]()
![]()
![]()
![]()
![]()
![]()
![]()
> for k from 1 to n do p[k]:=sum(a[i]*x^i/i!,i=0..k);od;
>
![]()
![]()
![]()
![]()
![]()
![]()
![]()
![]()
> plot({f(x),p[1],p[3],p[5],p[7],p[9]},x=-2*Pi..2*Pi,y=-6..6);
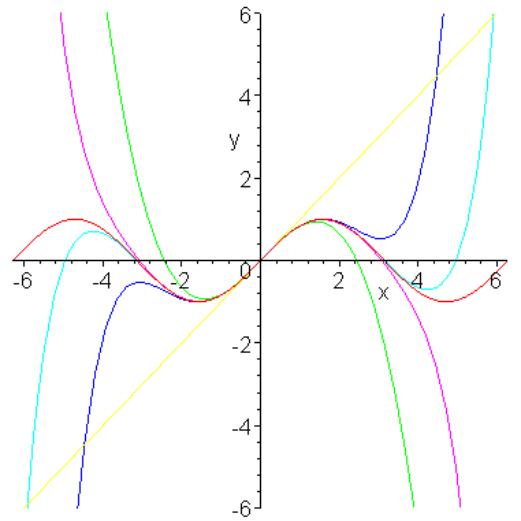
The graph of the sine function is shown in red, and the approximations are yellow, green, blue, lavender, and light blue, in that order. Notice that as the degree increases the approximation works better over a wider interval. It might be surprising to recall that these partial sums converge to the sine function for all values of x.